Introductory statistics course developed through the Ohio Department of Higher Education OER …
Introductory statistics course developed through the Ohio Department of Higher Education OER Innovation Grant. The course is part of the Ohio Transfer Module and is also named TMM010. For more information about credit transfer between Ohio colleges and universities please visit: www.ohiohighered.org/transfer.Team LeadKameswarrao Casukhela Ohio State University – LimaContent ContributorsEmily Dennett Central Ohio Technical CollegeSara Rollo North Central State CollegeNicholas Shay Central Ohio Technical CollegeChan Siriphokha Clark State Community CollegeLibrarianJoy Gao Ohio Wesleyan UniversityReview TeamAlice Taylor University of Rio GrandeJim Cottrill Ohio Dominican University
An association between two variables explains how one variable changes in response …
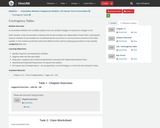
An association between two variables explains how one variable changes in response to changes in the other variable. A lack of association indicates that the two variables are independent of each other, meaning the chances of events of one variable are not affected by the occurrence or non-occurrence of events of the other variable. In this module we will learn about the different tools used for analyzing associations in two-variable categorical data sets.Learning Objectives:Identify response and explanatory variablesOrganize data into two-way tablesStudy joint, marginal and conditional distributions and learn the relationship between themObserved and expected frequencies, Chi-Square test statisticChi-Square test of independence – set up hypothesis, use technology to run the test and interpret P-valueTextbook Material - · Chapter 11.3 – Test of Independence – Pages 627 - 632
No restrictions on your remixing, redistributing, or making derivative works. Give credit to the author, as required.
Your remixing, redistributing, or making derivatives works comes with some restrictions, including how it is shared.
Your redistributing comes with some restrictions. Do not remix or make derivative works.
Most restrictive license type. Prohibits most uses, sharing, and any changes.
Copyrighted materials, available under Fair Use and the TEACH Act for US-based educators, or other custom arrangements. Go to the resource provider to see their individual restrictions.