This textbook is part of the OpenIntro Statistics series and offers complete …
This textbook is part of the OpenIntro Statistics series and offers complete coverage of the high school AP Statistics curriculum. Real data and plenty of inline examples and exercises make this an engaging and readable book. Links to lecture slides, video overviews, calculator tutorials, and video solutions to selected end of chapter exercises make this an ideal choice for any high school or Community College teacher. In fact, Portland Community College recently adopted this textbook for its Introductory Statistics course, and it estimates that this will save their students $250,000 per year. Find out more at: openintro.org/ahss
View our video tutorials here: openintro.org/casio openintro.org/TI
This is a "first course" in the sense that it presumes no …
This is a "first course" in the sense that it presumes no previous course in probability. The units are modules taken from the unpublished text: Paul E. Pfeiffer, ELEMENTS OF APPLIED PROBABILITY, USING MATLAB. The units are numbered as they appear in the text, although of course they may be used in any desired order. For those who wish to use the order of the text, an outline is provided, with indication of which modules contain the material.
Apply the sampling distribution of the sample mean as summarized by the …
Apply the sampling distribution of the sample mean as summarized by the Central Limit Theorem (when appropriate). In particular, be able to identify unusual samples from a given population.
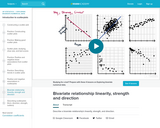
Describe a bivariate relationship's linearity, strength, and direction. In other words, plotting …
Describe a bivariate relationship's linearity, strength, and direction. In other words, plotting things that take two variables into consideration and trying to see whether there's a pattern with how they relate.
The most common way to calculate the correlation coefficient (r) is by …
The most common way to calculate the correlation coefficient (r) is by using technology, but using the formula can help us understand how r measures the direction and strength of the linear association between two quantitative variables.
This video talka about what is easily one of the most fundamental …
This video talka about what is easily one of the most fundamental and profound concepts in statistics and maybe in all of mathematics. And that's the central limit theorem.
Published by OpenStax College, Collaborative Statistics was written by Barbara Illowsky and …
Published by OpenStax College, Collaborative Statistics was written by Barbara Illowsky and Susan Dean, faculty members at De Anza College in Cupertino, California. The textbook was developed over several years and has been used in regular and honors-level classroom settings and in distance learning classes. This textbook is intended for introductory statistics courses being taken by students at two and fouryear colleges who are majoring in fields other than math or engineering. Intermediate algebra is the only prerequisite. The book focuses on applications of statistical knowledge rather than the theory behind it.
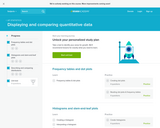
1). Summarize and describe the distribution of a categorical variable in context. …
1). Summarize and describe the distribution of a categorical variable in context. 2). Generate and interpret several different graphical displays of the distribution of a quantitative variable (histogram, stemplot, boxplot). 3). Summarize and describe the distribution of a quantitative variable in context: a) describe the overall pattern, b) describe striking deviations from the pattern. 4). Relate measures of center and spread to the shape of the distribution, and choose the appropriate measures in different contexts. 5). Compare and contrast distributions (of quantitative data) from two or more groups, and produce a brief summary, interpreting your findings in context. 5). Apply the standard deviation rule to the special case of distributions having the "normal" shape.
A set of step by step walk through of a hypothesis testing …
A set of step by step walk through of a hypothesis testing
one proportion z-test using p-values Chi-square goodness of fit using p-values one mean with population standard deviation is known using p-values one mean with population standard deviation is unknown, using p-value
Introductory statistics courses prepare students to think statistically but cover relatively few …
Introductory statistics courses prepare students to think statistically but cover relatively few statistical methods. Building on the basic statistical thinking emphasized in an introductory course, a second course in statistics at the undergraduate level can explore a large number of statistical methods. This text covers more advanced graphical summaries, One-Way ANOVA with pair-wise comparisons, Two-Way ANOVA, Chi-square testing, and simple and multiple linear regression models. Models with interactions are discussed in the Two-Way ANOVA and multiple linear regression setting with categorical explanatory variables. Randomization-based inferences are used to introduce new parametric distributions and to enhance understanding of what evidence against the null hypothesis “looks like”. Throughout, the use of the statistical software R via Rstudio is emphasized with all useful code and data sets provided within the text. This is Version 3.0 of the book.
Introduction to Financial Mathematics: Concepts and Computational Methods serves as a primer …
Introduction to Financial Mathematics: Concepts and Computational Methods serves as a primer in financial mathematics with a focus on conceptual understanding of models and problem solving. It includes the mathematical background needed for risk management, such as probability theory, optimization, and the like. The goal of the book is to expose the reader to a wide range of basic problems, some of which emphasize analytic ability, some requiring programming techniques and others focusing on statistical data analysis. In addition, it covers some areas which are outside the scope of mainstream financial mathematics textbooks. For example, it presents marginal account setting by the CCP and systemic risk, and a brief overview of the model risk. Inline exercises and examples are included to help students prepare for exams on this book.
We are constantly bombarded by information, and finding a way to filter …
We are constantly bombarded by information, and finding a way to filter that information in an objective way is crucial to surviving this onslaught with your sanity intact. This is what statistics, and logic we use in it, enables us to do. Through the lens of statistics, we learn to find the signal hidden in the noise when it is there and to know when an apparent trend or pattern is really just randomness. The study of statistics involves math and relies upon calculations of numbers. But it also relies heavily on how the numbers are chosen and how the statistics are interpreted.
This work was created as part of the University of Missouri’s Affordable and Open Access Educational Resources Initiative (https://www.umsystem.edu/ums/aa/oer). The contents of this work have been adapted from the following Open Access Resources: Online Statistics Education: A Multimedia Course of Study (http://onlinestatbook.com/). Project Leader: David M. Lane, Rice University. Changes to the original works were made by Dr. Garett C. Foster in the Department of Psychological Sciences to tailor the text to fit the needs of the introductory statistics course for psychology majors at the University of Missouri – St. Louis. Materials from the original sources have been combined, reorganized, and added to by the current author, and any conceptual, mathematical, or typographical errors are the responsibility of the current author.
No restrictions on your remixing, redistributing, or making derivative works. Give credit to the author, as required.
Your remixing, redistributing, or making derivatives works comes with some restrictions, including how it is shared.
Your redistributing comes with some restrictions. Do not remix or make derivative works.
Most restrictive license type. Prohibits most uses, sharing, and any changes.
Copyrighted materials, available under Fair Use and the TEACH Act for US-based educators, or other custom arrangements. Go to the resource provider to see their individual restrictions.