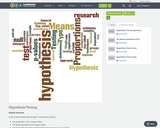
A set of step by step walk through of a hypothesis testing …
A set of step by step walk through of a hypothesis testing
one proportion z-test using p-values Chi-square goodness of fit using p-values one mean with population standard deviation is known using p-values one mean with population standard deviation is unknown, using p-value
Introductory statistics course developed through the Ohio Department of Higher Education OER …
Introductory statistics course developed through the Ohio Department of Higher Education OER Innovation Grant. The course is part of the Ohio Transfer Module and is also named TMM010. For more information about credit transfer between Ohio colleges and universities please visit: www.ohiohighered.org/transfer.Team LeadKameswarrao Casukhela Ohio State University – LimaContent ContributorsEmily Dennett Central Ohio Technical CollegeSara Rollo North Central State CollegeNicholas Shay Central Ohio Technical CollegeChan Siriphokha Clark State Community CollegeLibrarianJoy Gao Ohio Wesleyan UniversityReview TeamAlice Taylor University of Rio GrandeJim Cottrill Ohio Dominican University
In this module we will learn about discrete random variables, their distributions …
In this module we will learn about discrete random variables, their distributions and properties. Of specific interest would be a binomial random variable, its distribution and applications.Learning Objectives:Discrete random variable, distribution, mean and standard deviationBinomial random variable and its distributionTextbook Material - Chapter 4 – Probability Topics – Pages 239 - 257Suggested Homework:Discrete Random Variable - 69, 70, 74, 75, 76, 78, 96, 102Binomial Distribution – Odds 88 - 111
A data set is a listing of variables and their observed values …
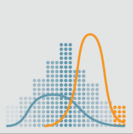
A data set is a listing of variables and their observed values on individuals or objects of study. In this topic we will learn about numerical summaries of data on a single variable and learn how to use them to describe data distribution and determine unusual values in the data. The type of numerical summaries to use depend on the data. We will also learn about boxplots.Learning Objectives:Understand which numerical summaries must be used to represent dataBe able to compute and interpret them. Also, know their properties and relative advantages and disadvantages. Further, use these measures to describe distributions, compare values from distributions, detect unusual values in the data, etc.For categorical data use counts and proportions to describe categoriesFor quantitative data useMeasures of Center – Mean, Median, ModeMeasure of Spread – Range, Interquartile Range (IQR), Variance and Standard DeviationMeasures of Location – Minimum, Maximum, Quartiles and PercentilesLearn to distinguish between different types of distributions for quantitative data – symmetric, skewed, bell-shaped, multimodal distributionsLearn about Empirical Rule for bell-shaped distributionsUse z-scores to compare values and detect unusual valuesMake boxplot of dataTextbook Material: Chapter 2 – Descriptive Statistics – Pages 88 - 122Suggested HomeworkChapter 2 - Descriptive Statistics – 29, 31, 32, 43, 57, 60, 69, 71, 82, 84, 86, 88, 89, 104, 106, 108, 109, 115, 119
No restrictions on your remixing, redistributing, or making derivative works. Give credit to the author, as required.
Your remixing, redistributing, or making derivatives works comes with some restrictions, including how it is shared.
Your redistributing comes with some restrictions. Do not remix or make derivative works.
Most restrictive license type. Prohibits most uses, sharing, and any changes.
Copyrighted materials, available under Fair Use and the TEACH Act for US-based educators, or other custom arrangements. Go to the resource provider to see their individual restrictions.